Rationale
The reason for using an STM32 discovery board is its affordability. That’s why I suggested in class that it be purchased for home play.
The course’s lab activity has been designed in such a way as to enhance that possibility, so open-source software and/or limited versions of commercial software are used to allow you to create your own home lab environment.
Using affordable tools maximizes the possibility of entering this complex world of microcontrollers.
I insist that the recommendation is still to get one of these boards. Even in the current situation.
That said, the current situation of confinement at home needs new approaches, so I am trying to find alternative solutions.
The proposal would be to try to simulate/emulate the discovery plate in order to develop the practical activities and the mini-project.
The truth is that I have not found many free/demo/etc options (for example, using Proteus is discarded because I don’t have student licenses for the STM32 module).
The proposal is to use the Keil to simulate non-peripheral code and to use QEMU for ARM to emulate the board.
Simulating with Keil uVision 5
Keil uVision 5 includes a simulator that lets to run code without the need for hardware. Great … but there is a problem. I’d rather start by showing you so you can understand.
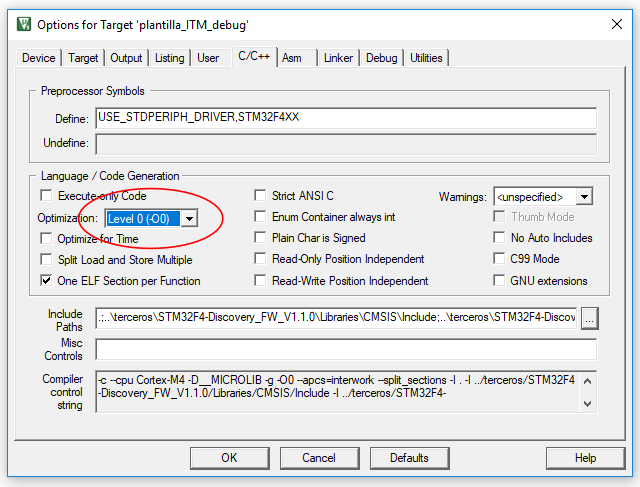
Let’s build the template … -> go to Options of the project -> C/C++ and verify that the compiler optimizations are disables
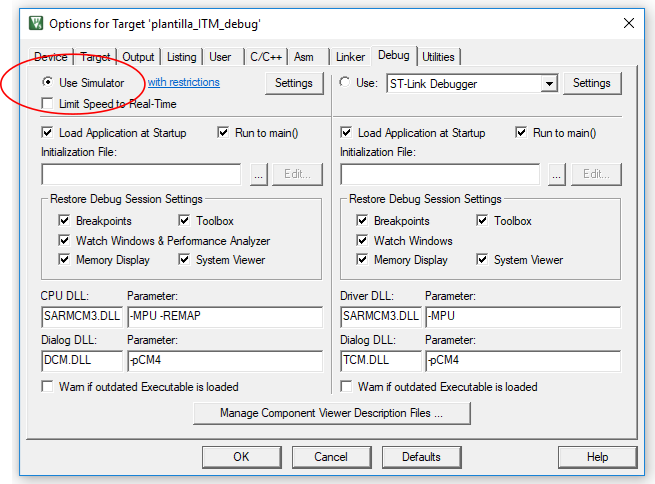
Let’s go to Debug -> Activate the simulator …
Ok, let’s start the Debugging session, play … WHAT THE HELL IS THAT ERROR!!!
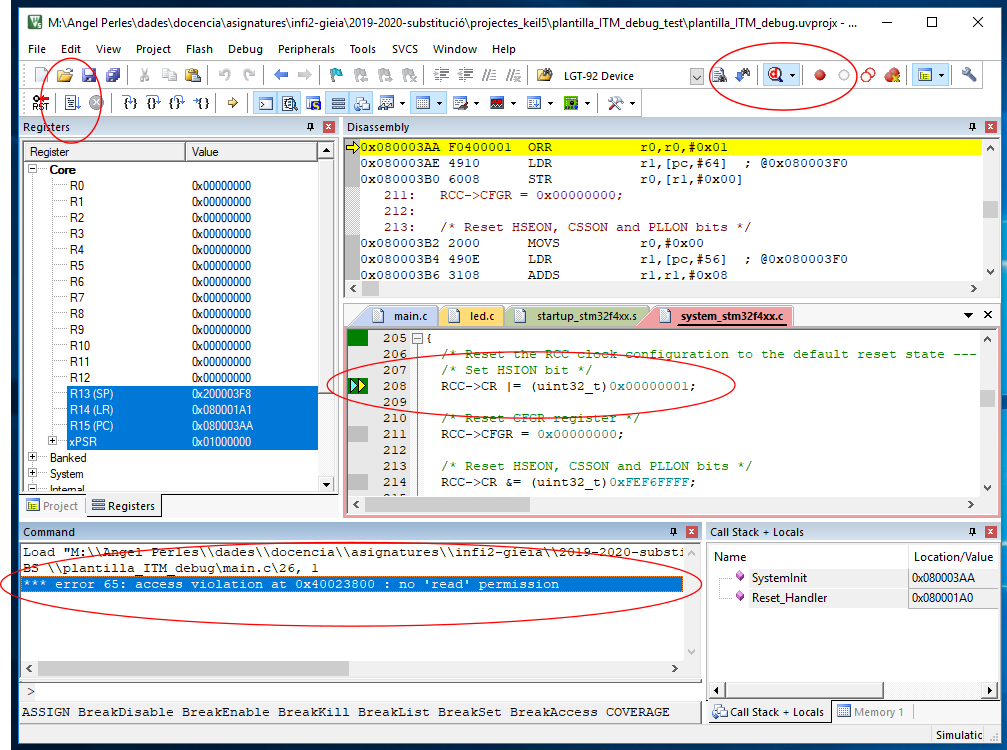
Well, further reading highlights that only the ARM Cortex-M core is simulated, not the manufacturer-specific characteristics such as the devices. In this case, “*** error 65: access violation at …” means that the debugger complains because of the access to a memory position of a peripheral that does not exist in the ARM Cortex-M core.
it is feasible to “step over” these instructions, but a more elegant option is to say to the debugger that it can read-write these positions. To do that, create a .ini file including the following text.
MAP 0x40000000,0x400FFFFF read write
call it keil_lamarequeva.ini for example, and include it in the configuration of the debug session.

And working. See below an example of session with breakpoints and checking the values of some variables.
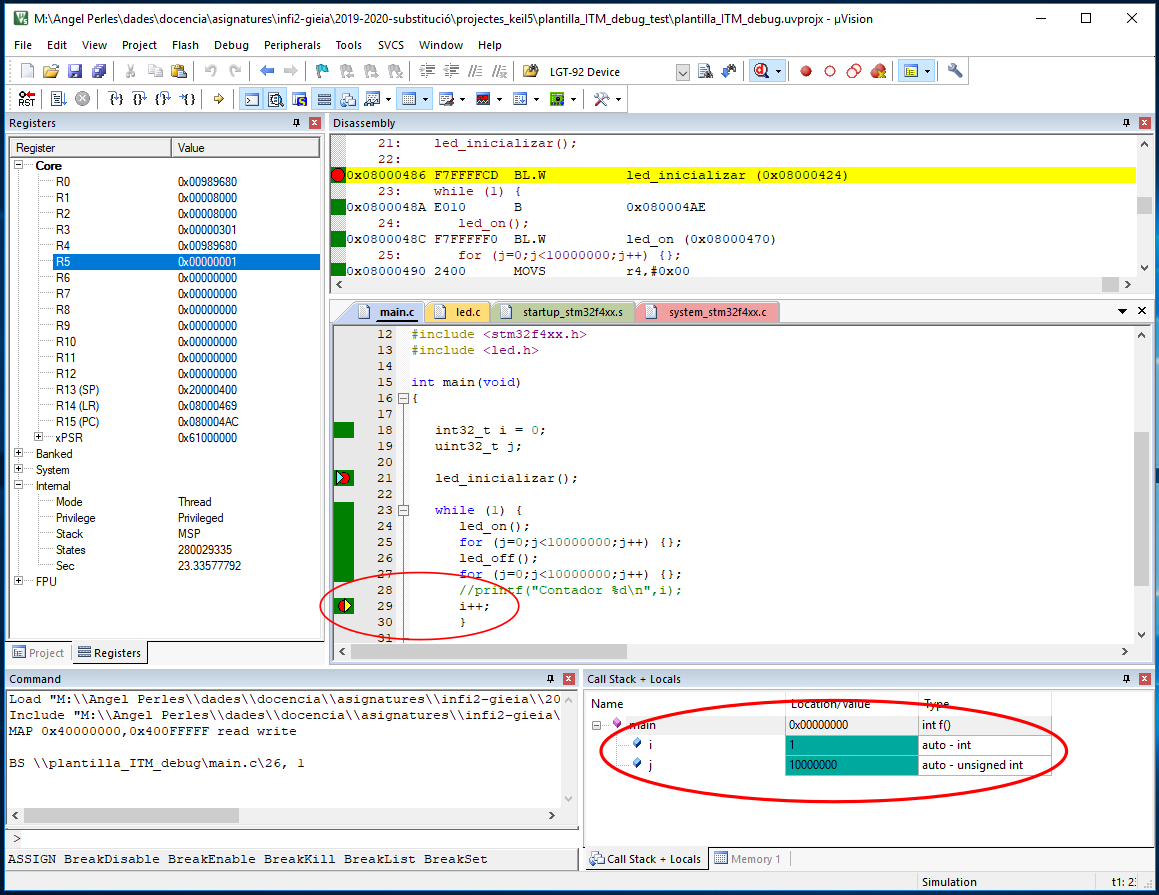
BUT only the “normal” C/C++ code is being evaluated. No peripherals can be tested here.
I suggest this procedure to test the logic of the application. When the application has been developed, then I suggest going to the next section.
Emulating the Stm32f4-discovery
The only “open” way that I found to emulate an STM32 microcontroller is using QEMU.
There is a project named xPack QEMU Arm which purpose is to emulate ARM Cortex-M based microcontrollers and bords. In fact, it supports the STM32F4-Discovery, great!!.
Let’s start installing, you can do it yourself reading the xPack QEMU install instructions. More or less, this is a digest of the steps:
- Assuming MWindows 10, download xpack-qemu-arm-xxxx-win32-x64. zip from the GitHub releases repository
- Uncompress the zip file a move it to C:\Users\<your user>\AppData\Roaming\xPacks You can’t view this directory using Windows Explorer, but it exists. You can use the navigation bar to access it. Do not worry if you see “Usuarios” because it is an “alias” of “Users”

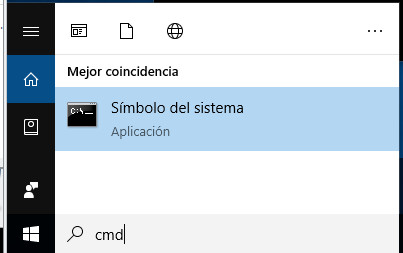
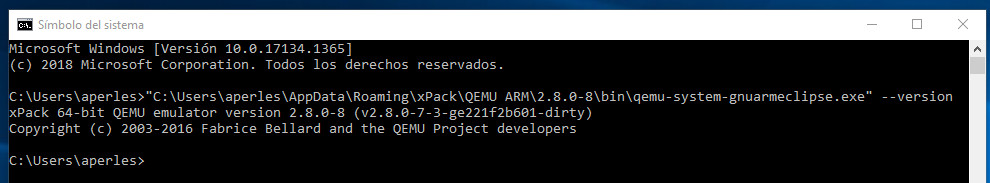
- Check that QEMU operates correctly opening a command window and writing
C:\Users\aperles>"C:\Users\aperles\AppData\Roaming\xPack\QEMU ARM\2.8.0-8\bin\qemu-system-gnuarmeclipse.exe" --version
If it works, then you can now build your Keil project a load the resulting image file in QEMU.
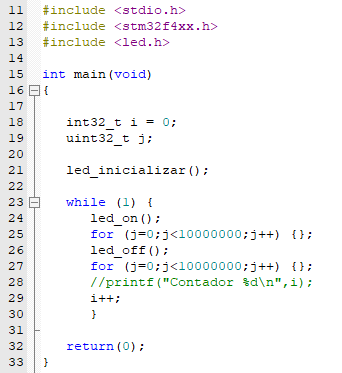
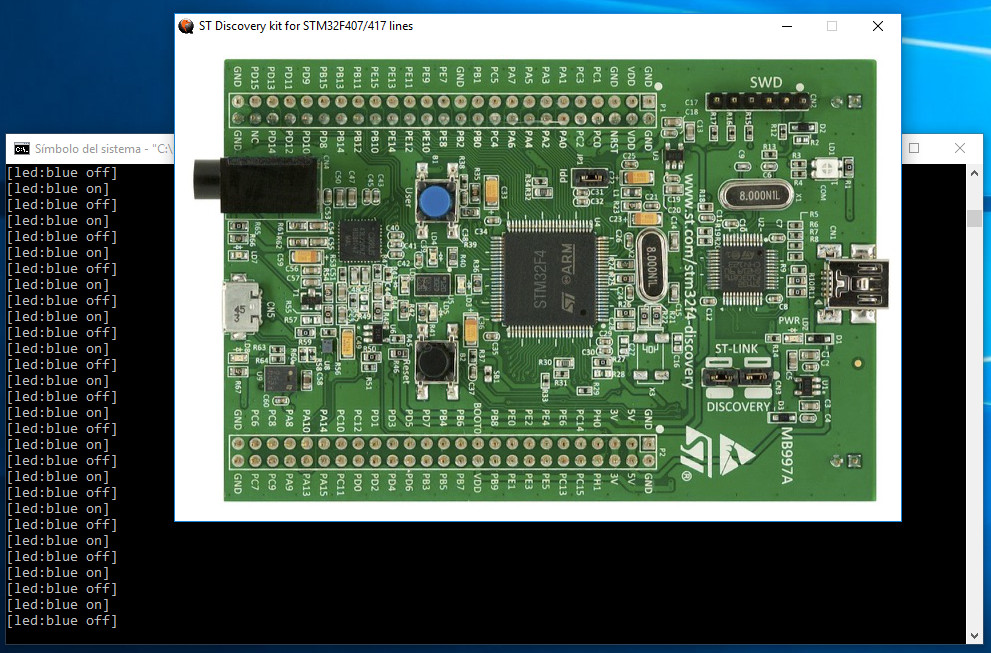
For example, I adapted the official template to handle a LED as shown in the next image,
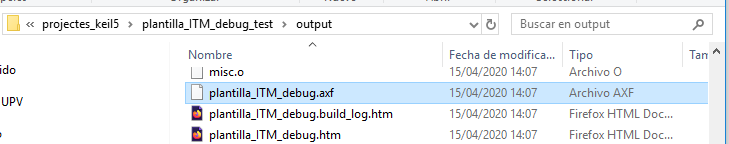
After building the project, and for this specific template, the image file is stored in subfolder “output” and named “plantilla_ITM_debug.axf“. In a different project, simply locate the corresponding”.axf” file.
Now load the image using the emulator in the following way adapting routes to find the .axf file if necessary,
H:\tmp>"C:\Users\aperles\AppData\Roaming\xPack\QEMU ARM\2.8.0-8\bin\qemu-system-gnuarmeclipse.exe" --board STM32F4-Discovery --mcu STM32F407VG -d unimp,guest_errors --semihosting-config enable=on,target=native --image plantilla_ITM_debug.axf
And, alehop!!!, your project will show up running in the discovery board.
Let’s go for the LIMITATIONS:
- You cannot debug your project in this way. It is feasible, but you need a GDB-based debugger and this completely out of the scope of this trick. BUy a real Discovery.
- Only a limited set of peripherals is emulated. I think that GPIO, including LEDs and button operation, and some interrupts, but not sure at all. Any volunteers to try?.
More information:
https://xpack.github.io/qemu-arm/options/